- Bill PDF attached; add CC addresses and a personal message
- Invalid addresses are caught before sending
- Every send is logged: how many times, when and to whom
Energy Intelligence & Management Platform
Every meter. Every tenant. Every bill.
One web-based platform to monitor electricity, water, gas and BTU/cooling, rank and analyse tenant consumption, and create, send and collect utility bills.
- Electricity
- Water
- Gas
- BTU / Cooling
- Utility types
- 4
- Electricity · Water · Gas · BTU
- Dashboards & diagrams
- 6
- Ranking to Single Line Diagram
- Account types
- 3
- Tenant · Owner · Management
- Ways to send bills
- 2
- E-mail and WhatsApp
01Platform overview
From meter reading to paid bill, in one place
Enerceon follows your energy from the meter to the money: monitor and analyse every utility, understand how meters connect, then bill, send and collect — without switching tools.
- Meters
Every utility, at every site, building, floor and space.
- Analyse
Rankings, yearly trends, live power and diagrams.
- Bill Builder
One account per bill, peak and off-peak priced.
- Send
Bill PDF by e-mail or on WhatsApp, every send logged.
- Collect
Record payments and close the gaps with Missing Bills.
Everything Enerceon does
Select a feature to see it in the software.
DashboardsEnergy & Meter Monitoring
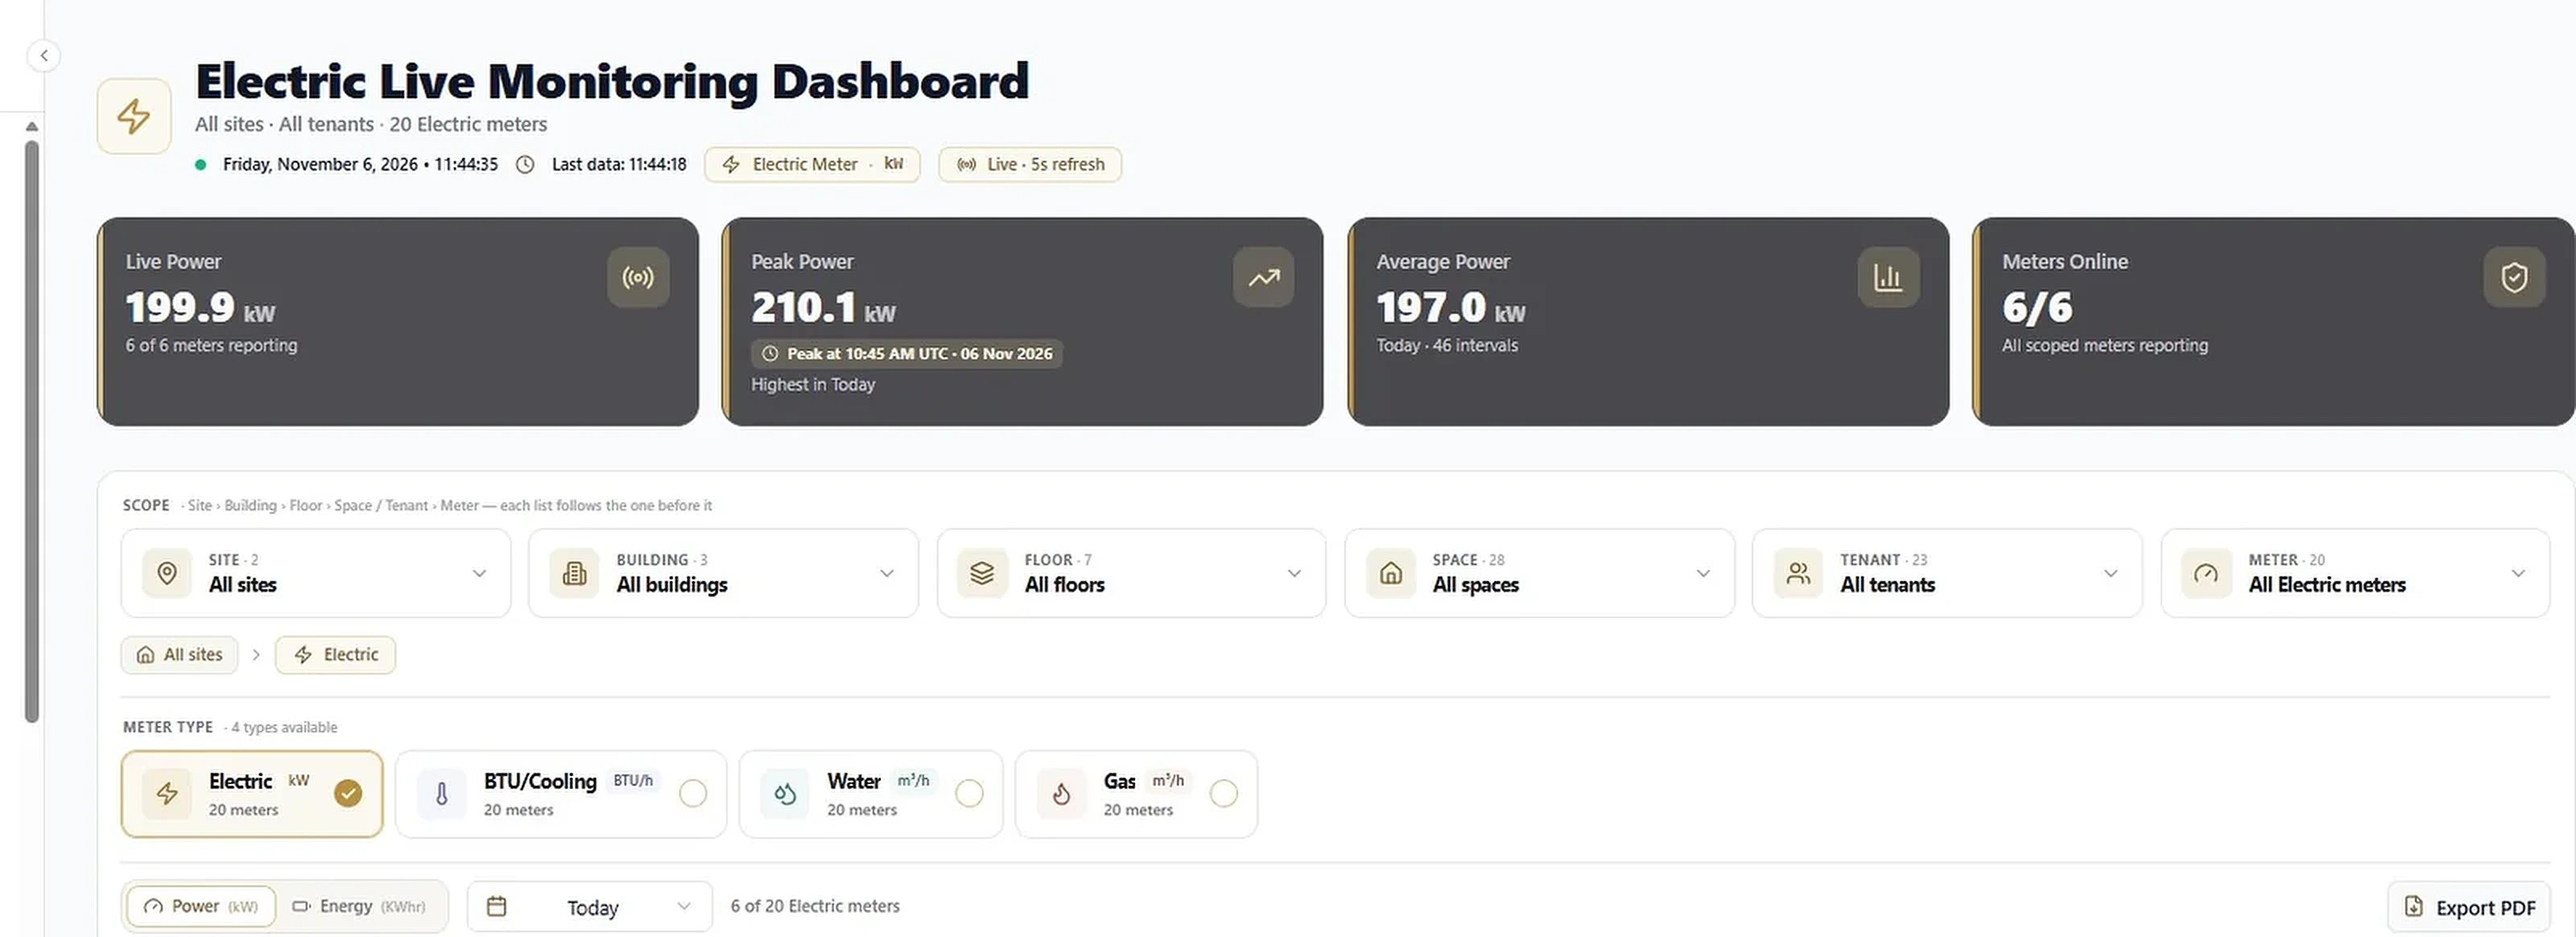
Live power, peak demand, average power and meters online, refreshed every few seconds with 15-minute intervals and Online, Delayed or Offline status per meter.
See it DashboardsReports & AnalyticsTenant ranking, yearly month-by-month trends, seasonality, top consumers, consumption distribution and meter statements, with PDF and Excel export.
See it DiagramsSingle Line DiagramYour complete metering hierarchy — main meters, child meters and sub-meters — drawn level by level, with link warnings and a meter detail panel.
See it DiagramsEnergy SourcesMeters grouped by utility and energy source, with each source's consumption distribution and every meter's share of it.
See it ManagementMeter ManagementRegister, assign and verify meters; set a monthly threshold; open live monitoring, deactivate, edit or export the register.
See it ManagementAccounts ManagementTenant, Building Owner and Building Management accounts, so every charge reaches the party responsible for that consumption.
See it BillingBill BuilderProfessional utility bills in seven steps: account, period, spaces, meter types, meters, tax and discounts, and due date — with a live preview.
See it BillingBilling OverviewBills generated, total billed, latest period and bills past due, billed per month, top tenants and recently saved bills.
See it BillingHistory, Payments & Missing BillsSearch every bill, record full or partial payments, find months with consumption but no bill, and see each tenant's full billing history.
See it BillingE-mail & WhatsApp DeliverySend any saved bill with its PDF by e-mail or as an approved WhatsApp template, after a review-and-approve check. Every send is logged.
See it ManagementUsers & RolesSystem Admin, Admin and Operator access, plus accounts that sign in to see their own meters, consumption and bills.
See it ConfigurationSettings, Tariffs & UnitsDate, time and currency formats, meter types, peak and off-peak billing rates, units and decimals, password rules and backups.
See it02Dashboards & analytics
See every utility, every tenant, every hour
Rank tenants, follow the year month by month, look inside every meter and watch live power — for electricity, water, gas and BTU/cooling, scoped from the whole portfolio down to one meter.
Ranking & drill-down
See who consumes the most, at a glance
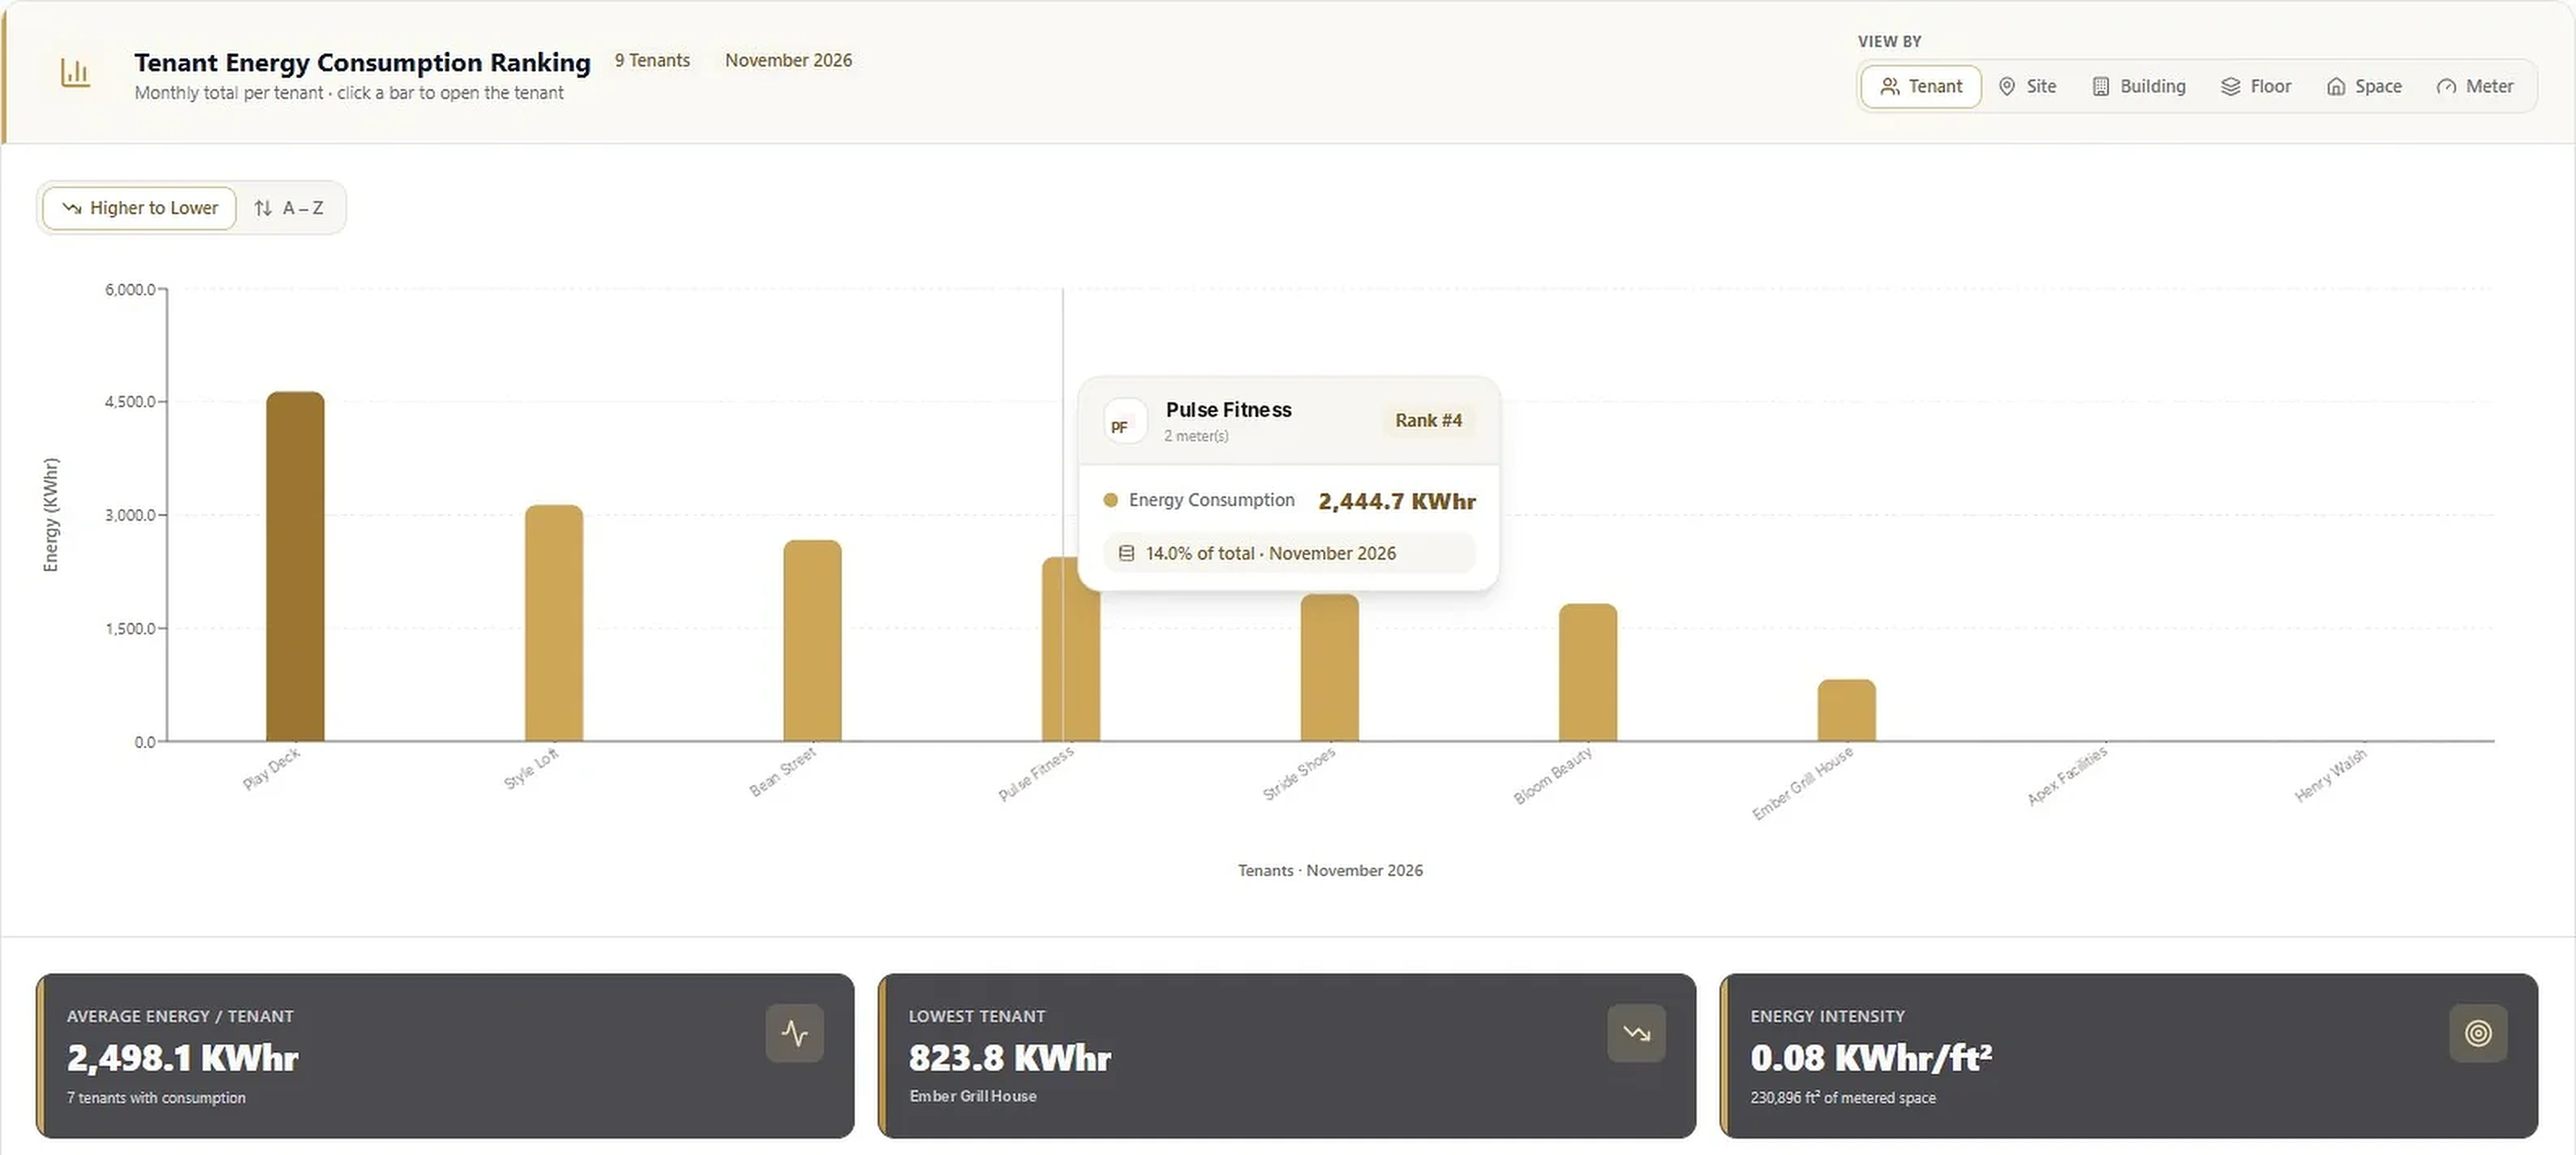
Rank every tenant by consumption for any scope and meter type, then drill down from the portfolio to a single meter.
- KPIs for total, peak and intensity per area for the selected period
- Scope by site, building, floor, space, tenant and meter type
- Active tenant cards open each tenant's meters
- Meter Statement: every meter with its location, tenant and consumption
Light & dark mode
One click between light and dark
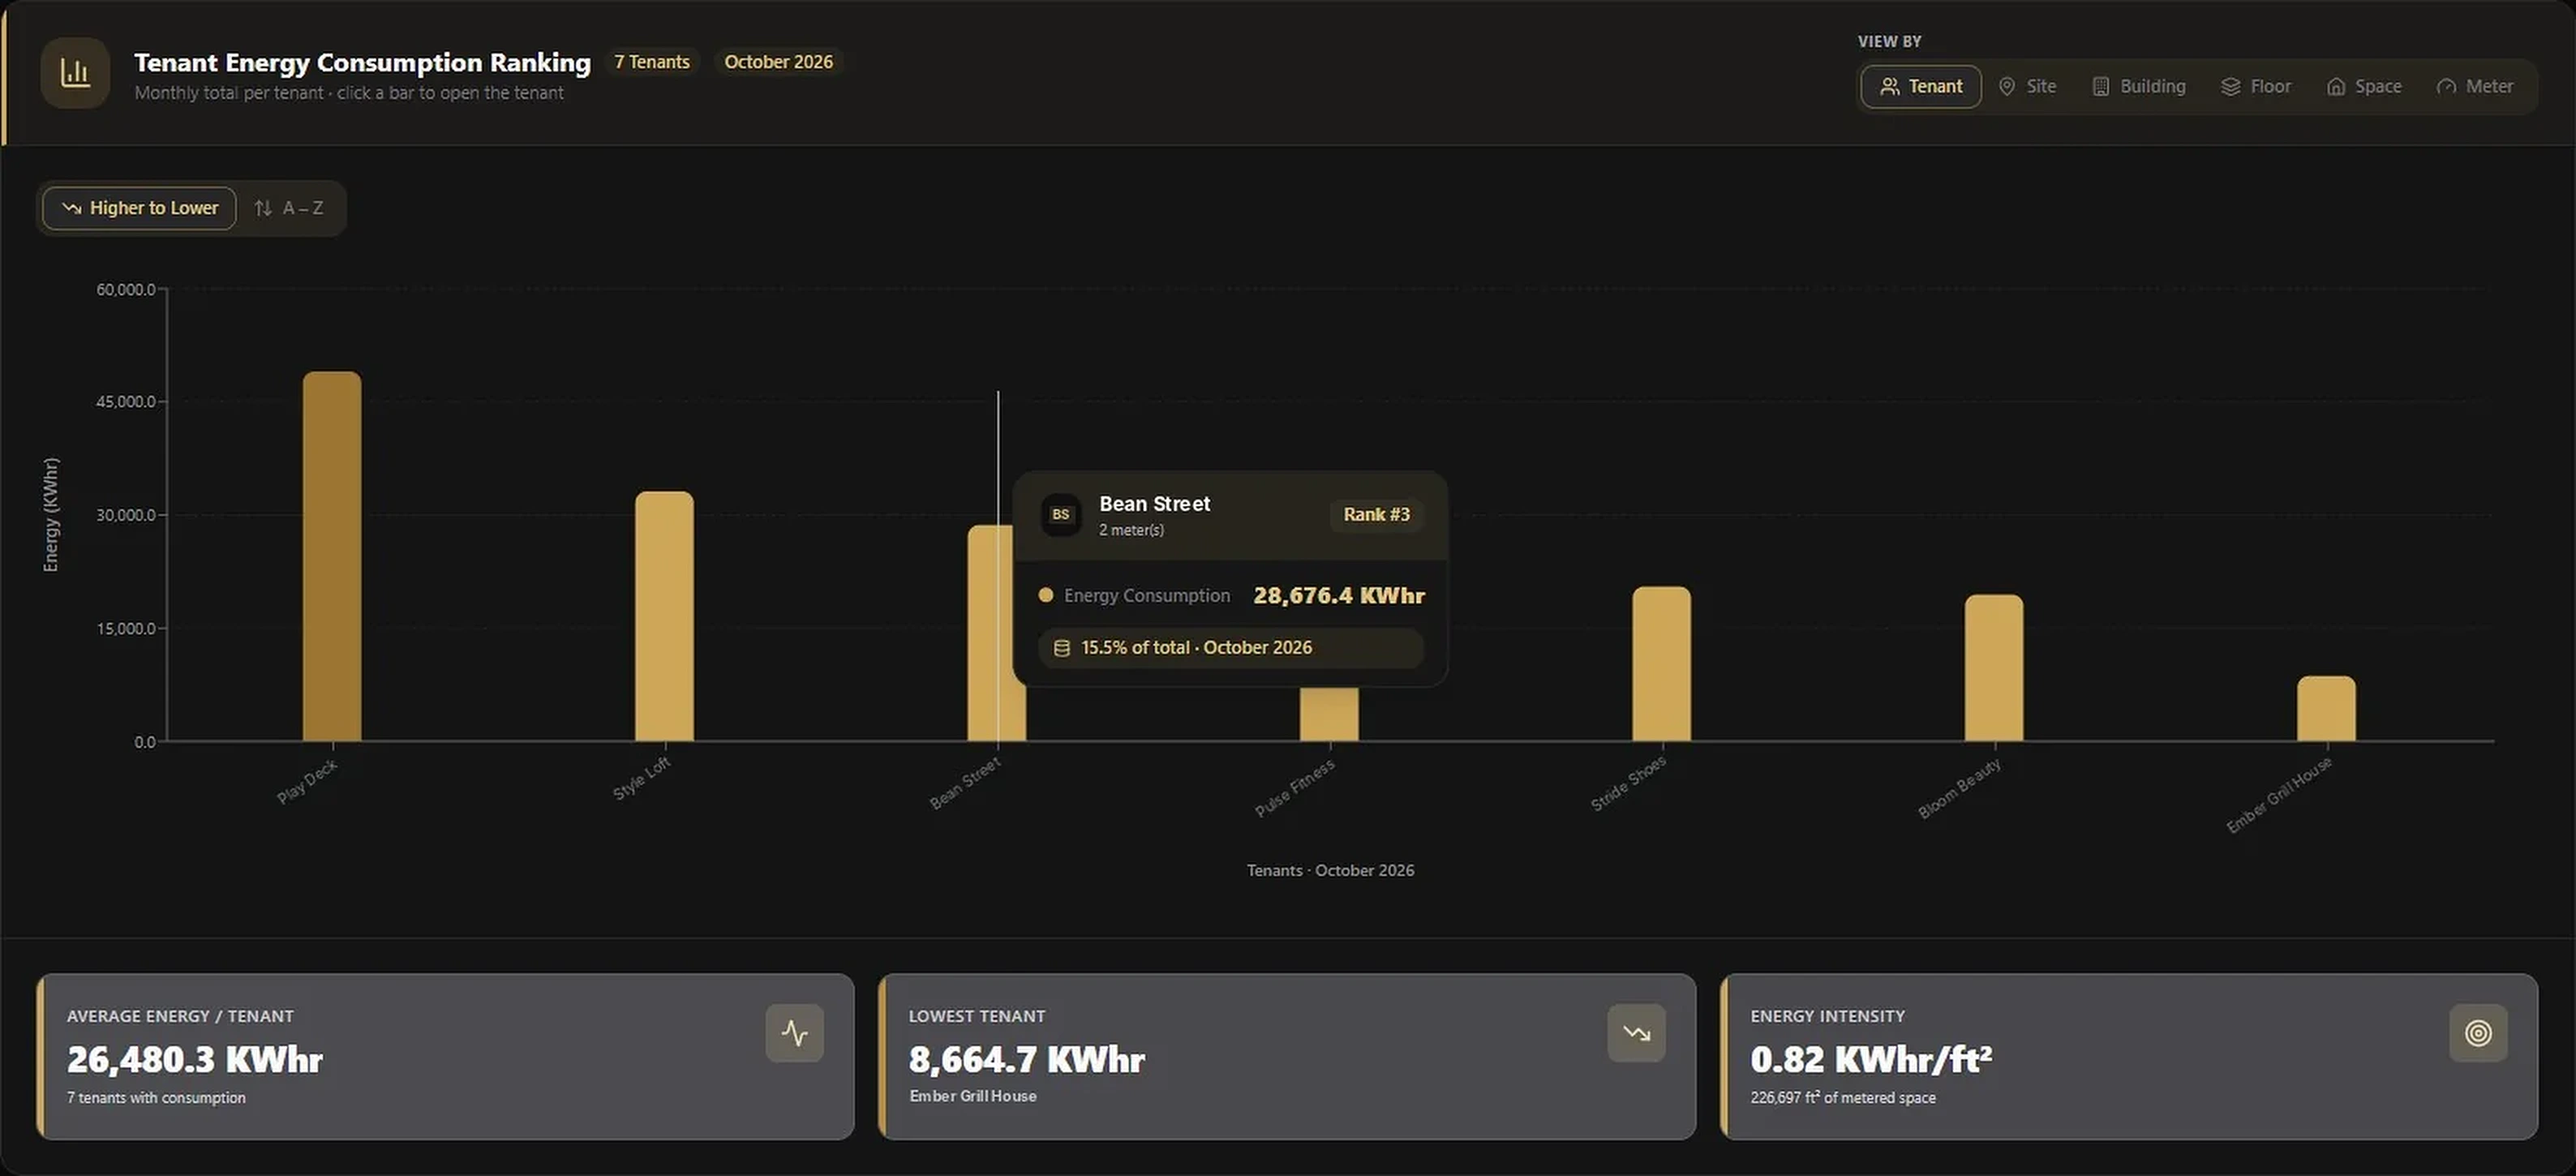
Drag the handle to compare the same Tenant Energy Consumption Ranking in both modes.
- ComfortableDark mode for control rooms and long shifts; light mode for reports and daylight.
- Per userEach user picks the mode they like, with one click.
- Same featuresEvery dashboard, chart and table works the same in both modes.
- Electricity
- Water
- Gas
- BTU / Cooling
03Diagrams
Know how meters connect — and what powers them
Two live diagrams built from your own meter register: the Single Line Diagram draws the parent/child hierarchy, and Energy Sources shows which source feeds which meter and how consumption is shared.
Single Line Diagram
Main meters, child meters and sub-meters
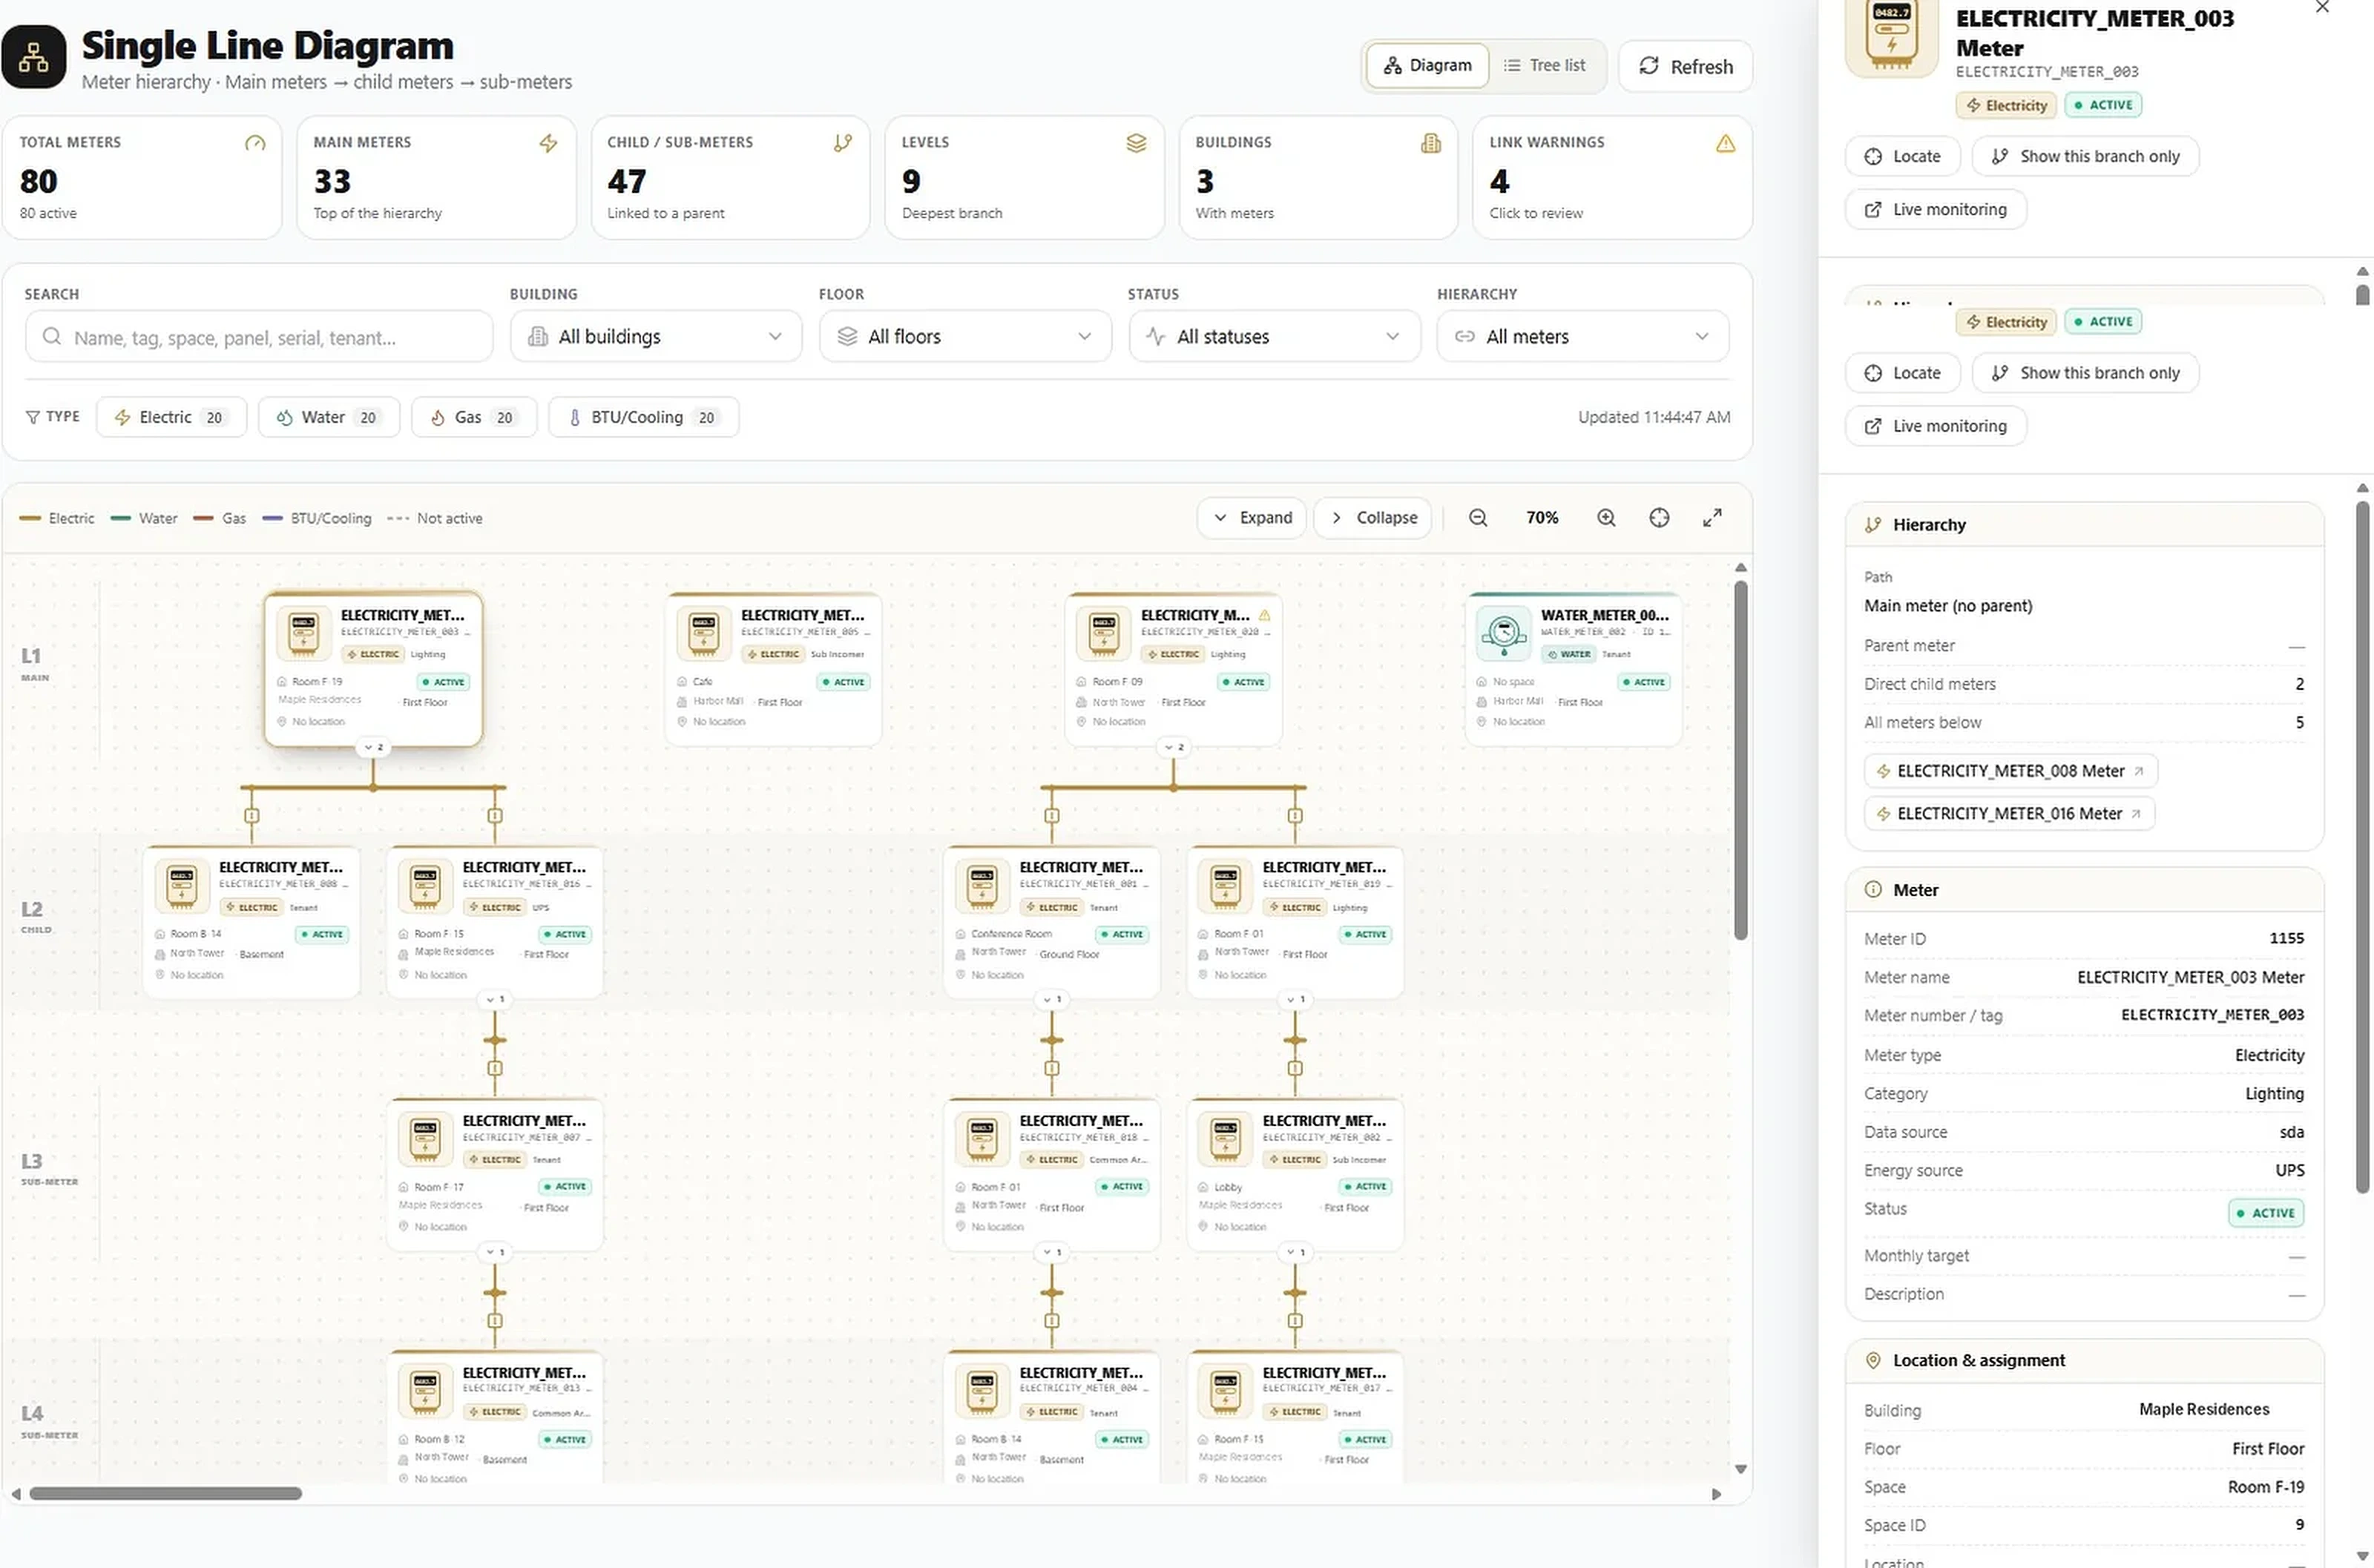
Your complete metering hierarchy, level by level, from main incomers down to tenant sub-meters, across every utility. Inactive links are dashed and broken links are flagged for review.
Hierarchy at a glance
Totals for meters, main meters, child and sub-meters, levels, buildings and link warnings to review.
Find any meter
Search by name, tag, space, panel, serial or tenant; filter by building, floor, status, hierarchy and meter type.
Diagram or tree list
Colour-coded lines per utility, inactive links dashed. Expand, collapse, zoom and full screen.
Meter detail panel
Path, parent, child meters, category, energy source, status and location. Locate, show this branch only, or open live monitoring.
Energy Sources
Every meter, traced to its energy source
Meters are grouped by meter type and energy source, so you see at a glance what runs on the grid, solar, a generator or UPS — and which meters still need a source. Each source shows its consumption distribution: a donut of its meters and a gauge with every meter's share, for the month or the year.
GridElectric · 4 meters · October
58% of Electric21,315.4kWh · Grid
- 40%ELECTRICITY_METER_0028,420.6 kWh
- 29%ELECTRICITY_METER_0186,210.3 kWh
- 19%ELECTRICITY_METER_0054,102.0 kWh
- 12%ELECTRICITY_METER_0112,582.5 kWh
Illustrative values. Totals are kept per meter type, so different units are never added together.
Each source card lists its meters, how many are active and its share, with every connected meter's status, category, space, building and parent meter.
Electric
Grid, Solar, Wind, Hydro, Battery, UPS, Generator, Fuel Cell, Cogeneration (CHP)
Water
Municipal supply, Borewell, Groundwater, Tanker, Rainwater, Desalinated, Recycled, Treated sewage effluent
Gas
Piped gas network, Natural gas, LPG, CNG, Biogas
BTU / Cooling
Chiller plant, Absorption chiller, Heat pump, DX unit, Boiler, Cooling tower, Thermal energy storage
04Accounts & management
Three account types, clear billing responsibility
Every bill is issued to one account, so each charge reaches the party responsible for that consumption. Meters, users and settings are managed in the same place.
TenantTenant
The occupant of a space. Meters in the tenant's spaces are billed to the tenant.
Building OwnerBuilding Owner
The owner of the property. Consumption the owner is responsible for is billed to this account.
Building ManagementBuilding Management
The facility or management company, for consumption under its responsibility.
- Account details
Account code, contact person and number, e-mail, tags (VIP, Critical Load, 24×7 Operations…), status and last login.
- Find fast
Search by name, e-mail, ID or code; filter by type; table or grid view; sort any column.
- Secure access
Accounts can sign in to their own portal; passwords are masked and only the Super Admin can reveal them.
Meters, users and settings
Register and control every meter, give every person the right access, and configure once.
Meters Management
Register, assign and control every meter
Total, active, inactive and assigned meters, with location, assigned space, installation date and account.
- Filter by meter type and assignment
- Set a monthly threshold per meter
- Open live monitoring, deactivate, edit or delete
- New meters are verified before they are added; export the register
05Billing
Professional utility bills, built in seven steps
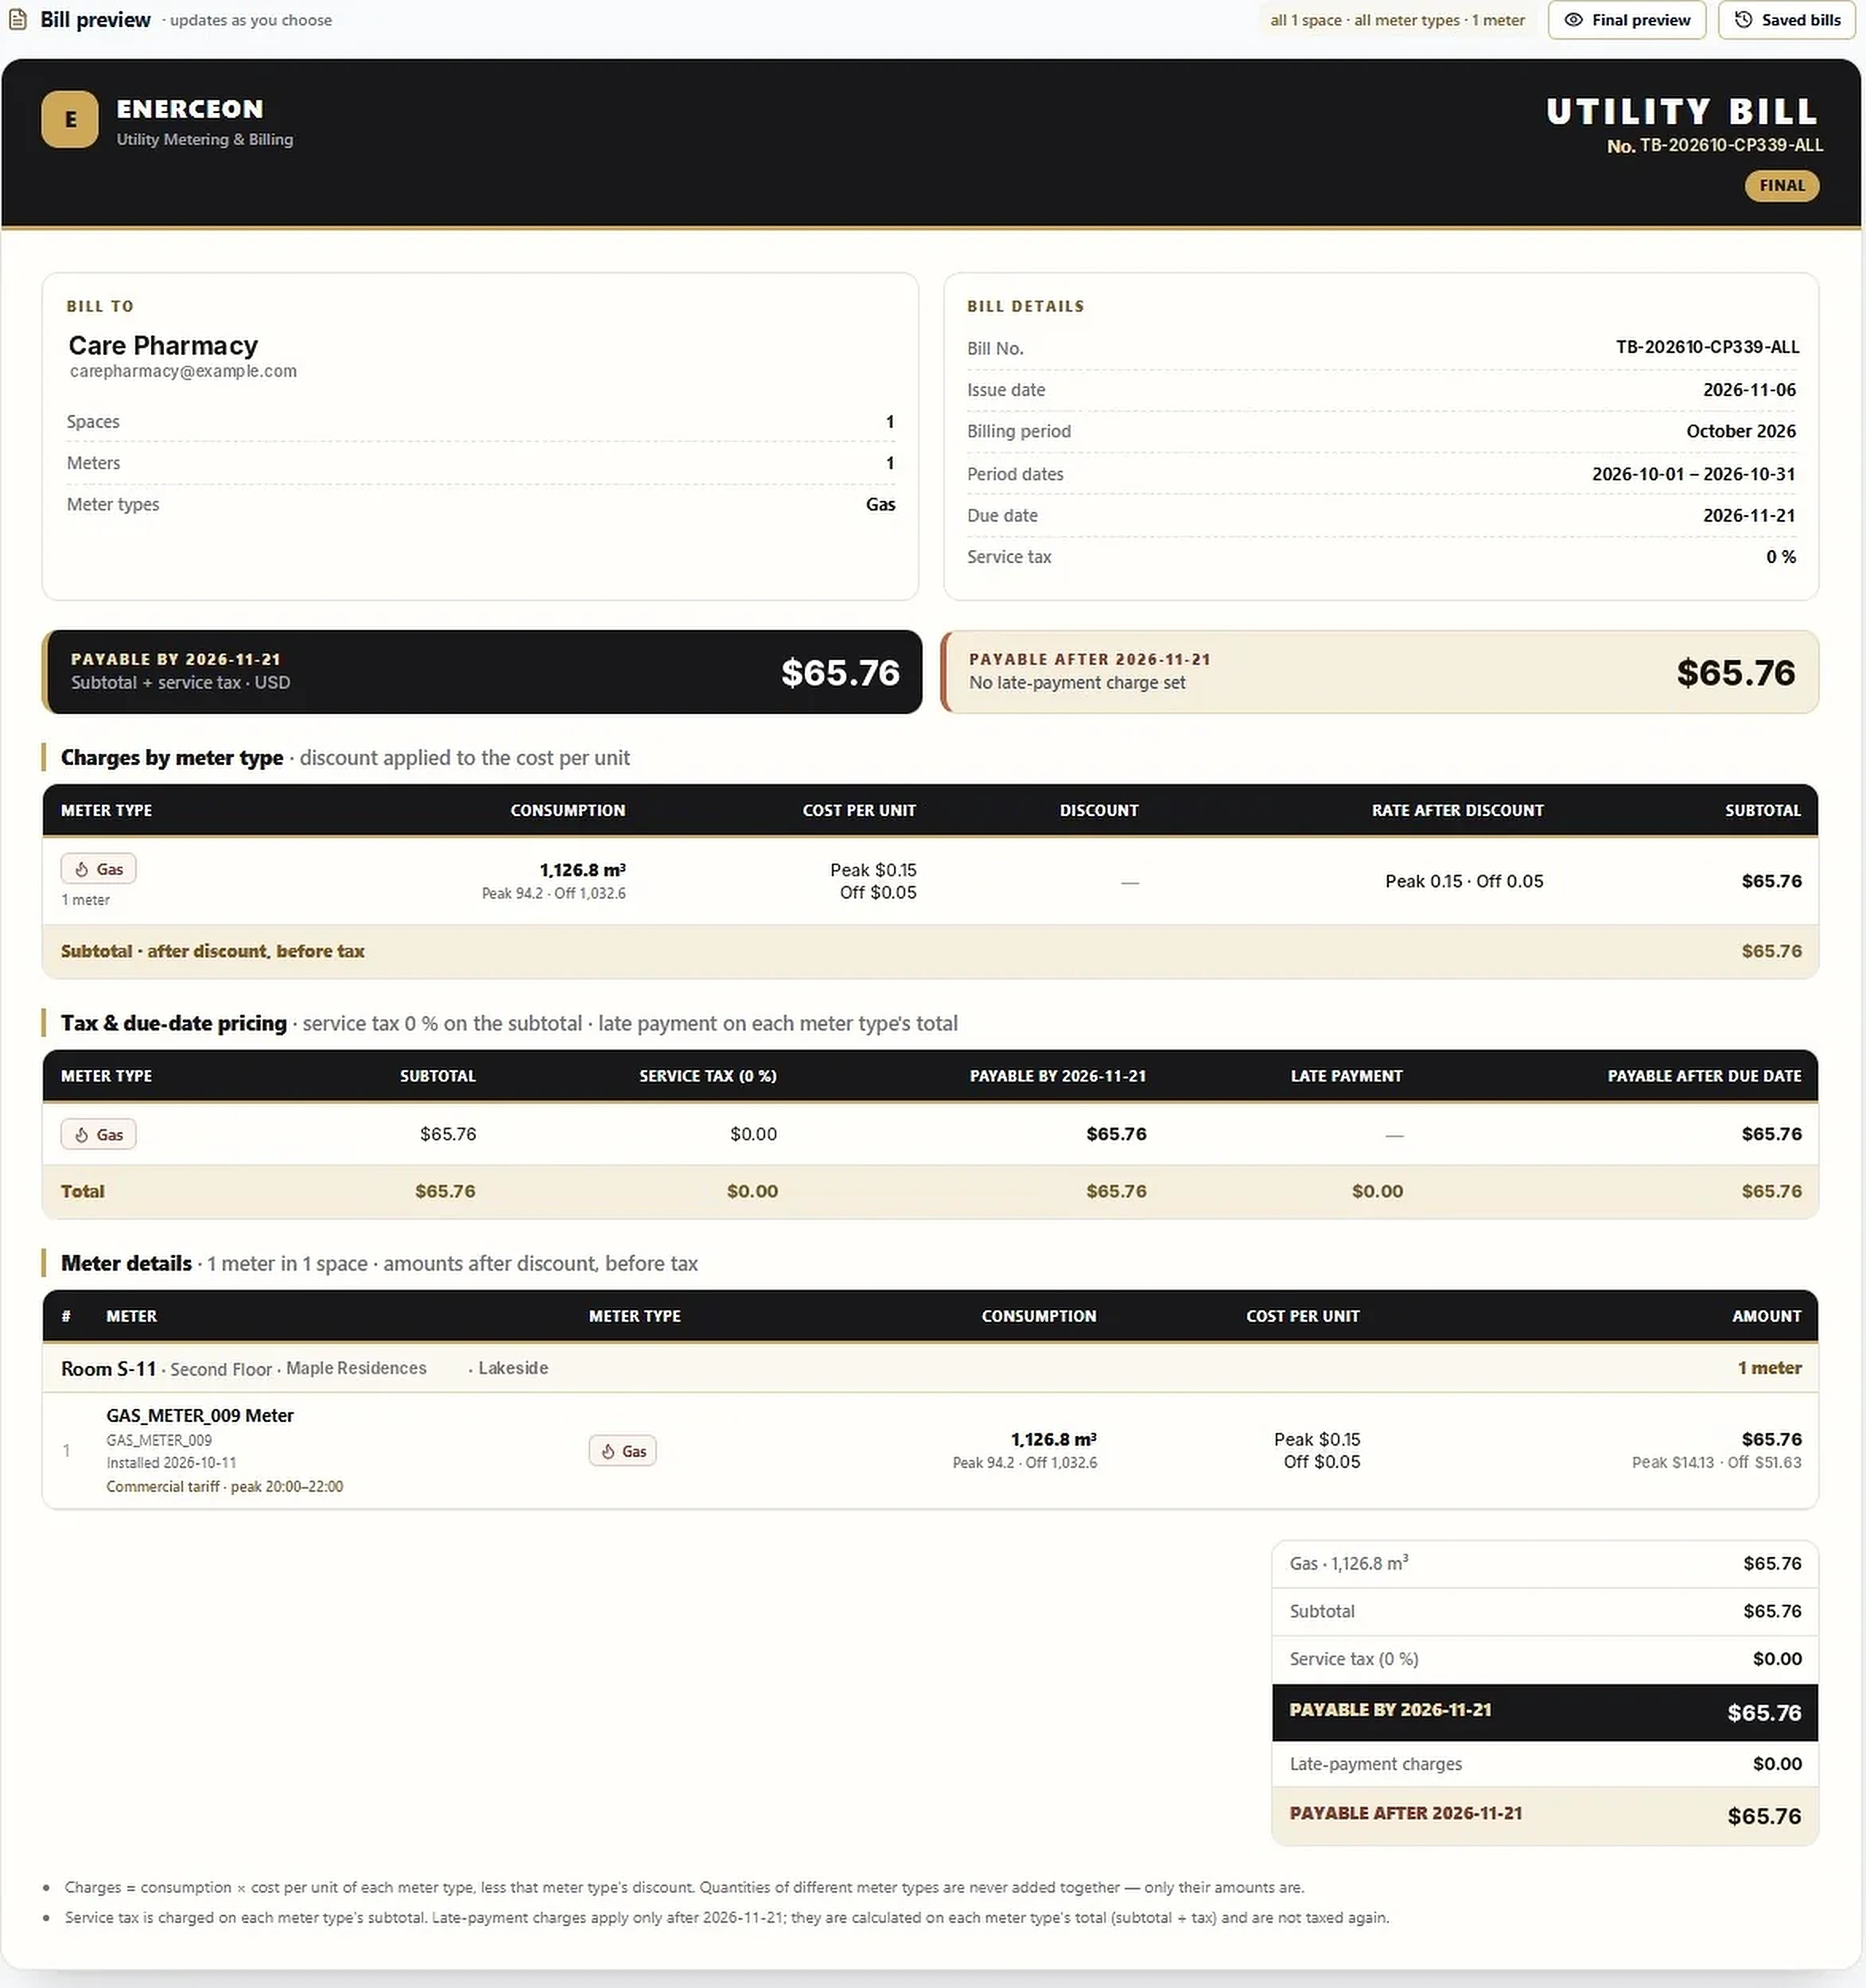
The Bill Builder turns saved consumption into a clear, priced bill for one account — peak and off-peak, tax, discounts and late payment included — with a live preview as you choose.
- 1Tenant
Choose the account the bill is issued to.
- 2Billing period
Monthly or yearly; closed periods marked Final.
- 3Spaces
One, several or all of the account's spaces.
- 4Meter types
Each keeps its own unit and rate.
- 5Meters
Every matching meter with its consumption.
- 6Tax, discounts & late payment
Service tax %, discount and late-payment % per meter type.
- 7Due date & note
On receipt, 7, 15 or 30 days, or a date.
- Live bill preview with bill number, issue date, period and due date
- Peak and off-peak consumption priced at each tariff's rates
- Amounts payable by and after the due date
- Final preview, saved bills, and download as PDF or Excel
Billing Management
Overview, history, payments, missing bills and every tenant's billing history.
Every bill, exactly as it was billed
The state of billing on one page
Every bill saved from the Bill Builder, with amounts exactly as they were billed.
- Bills generated, total billed, latest period and bills past due
- Billed per month, including late-payment charges
- Top tenants by amount
- Recently saved bills with preview, print and Excel
Bill distribution
Deliver bills by E-mail or WhatsApp
Send any saved bill straight to the account from Bill History, with the bill PDF attached, and keep a record of every delivery. The dialog shows the amount payable by and after the due date before you send.
- An approved message template plus the bill PDF, to the account's registered number
- Carries account, bill number, period, meters, consumption, peak / off-peak, amount, due date and payment status
- A review-and-approve checkbox must be ticked before any bill is sent
Screens shown with fictional demo data.
06Why Enerceon
Accurate bills, faster collection, full visibility
Complete visibility
Every site, building, floor, space, tenant and meter in one place, live and historical, for all four utilities.
Numbers that agree
Dashboards, reports and bills use the same records, so every bill matches the consumption shown.
Fair, transparent billing
Peak and off-peak tariffs, tax, discounts and late-payment rules applied consistently to every account.
Faster collection
Send bills by e-mail or WhatsApp in seconds and track every payment and outstanding balance.
No revenue left behind
Missing Bills finds every month with consumption but no bill, ready to generate.
Know your infrastructure
Single Line Diagram and Energy Sources show how meters connect and what powers them.
Built for
- Shopping malls
- Office towers
- Residential buildings
- Mixed-use developments
- Hotels
- Data centres
- Facility management companies
- Property owners
07Live Preview
Don't just read about it — drive it
The real Enerceon software, running live. Open it in a new tab and see for yourself how every meter, tenant and bill comes together.
Live demo · nothing to install
Step inside Enerceon
Skip the slideshow. Click through the actual dashboards, trace any meter back to its main incomer, see what each energy source consumes and build a bill in seconds — the same screens your team will use every day.
What you can try
- Tenant ranking & yearly trends
- Live power monitoring
- Single Line Diagram
- Energy Sources
- Bill Builder
- E-mail & WhatsApp delivery
Opens in a new tab. Need access? Ask our team.
08Talk to us
See your facility in Enerceon.
Ask us for a live walkthrough with your own sites, meters and accounts — from the first dashboard to the first bill sent.